

 Facebook
 X
X
 Pinterest
 Copy Link
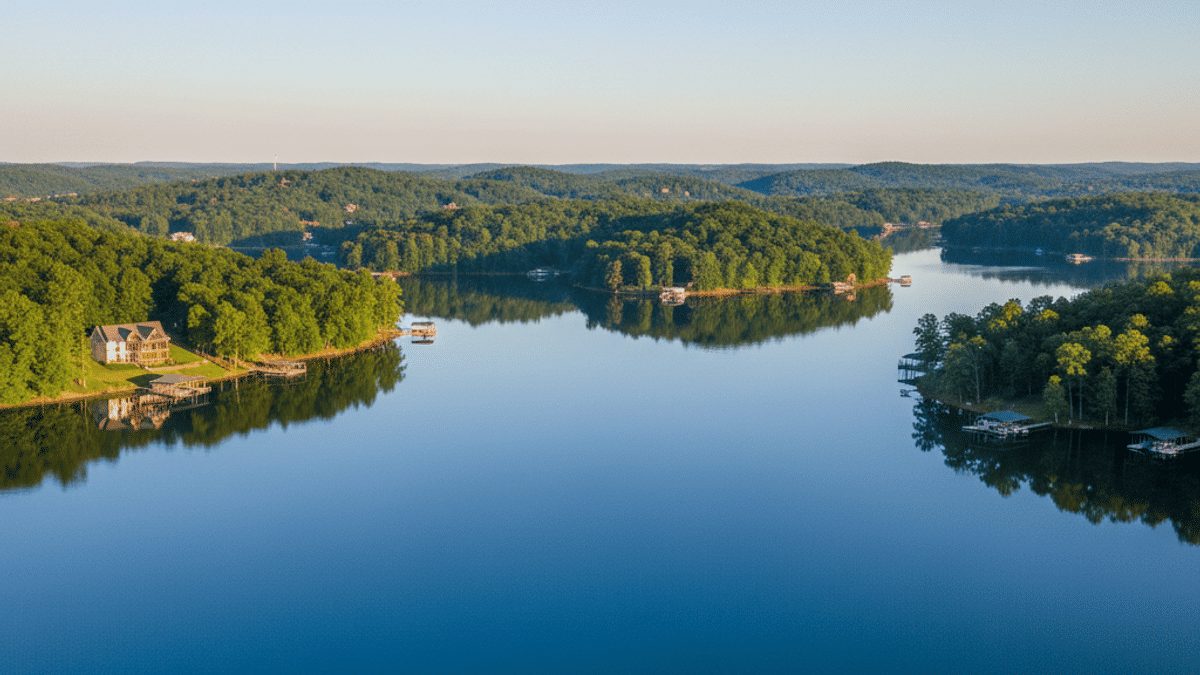
Douglas Lake, Tennessee sits in East Tennessee across Jefferson, Grainger, and parts of Cocke County, and it functions as both a lakeside residential area and a regional recreational hub.
Tracking the Douglas Lake real estate market matters because lakefront living, acreage parcels, and short-term rental interest create different supply and demand dynamics than nearby metro markets. This Market Report pulls together the latest pricing of homes for sale in Douglas Lake, sales, and value signals so you can see how listings, closings, and finance are interacting YTD in 2025.
What is the Current State of the Douglas Lake Real Estate Market?
Douglas Lake’s market in 2025 shows steady demand for lakefront and near-lake homes, with active inventory concentrated around Dandridge, Baneberry, and the Jefferson City corridors. Local brokers and lake-home aggregators report roughly 150–225 lake-related listings at snapshot periods in 2025, a supply level that gives buyers choices but still lets well-priced lakefront homes attract attention quickly.
Regional market indexes tell a slightly different story at the county level. Zillow’s Jefferson County overview reports a modest year-over-year rise in typical home values and median sale/list metrics that reflect more stable county activity; for buyers and sellers on Douglas Lake, combine lake-specific comparables with county metrics for a complete picture.
Average List Price
List prices on Douglas Lake vary widely by frontage, acreage, and finished improvements. Broker and MLS snapshots for lakefront listings in mid-2025 show median list points ranging from the mid-$400,000s for smaller, non-prime frontage homes up to $800,000+ for larger, turnkey lakefront properties with multiple bedrooms and finished living area.
Expect the median list price for prime frontage to be meaningfully higher than inland comparables.
Because many Douglas Lake properties are marketed as lakefront or acreage parcels, the average list price depends heavily on how many high-amenity frontages vs vacant land parcels are active at any snapshot. Use listing-level filters (shoreline feet, acre, bedrooms) to align comparables with your target property type.
Average Sales Price
Sales price distributions on Douglas Lake show that closed transactions for true lakefront homes often sit well above general county medians.
Local market reports indicate median sold prices for lakefront closings in 2025 that frequently exceed $500,000 for improved properties, while inland or non-waterfront sales closer to Jefferson City and Dandridge track closer to county medians. Use recent closed sales with similar frontage and lot size to estimate market value.
Because lakefront sales volume is limited, single high-dollar closings can push short-term medians higher; pairing sale-price medians with a ZHVI- or county-level baseline reduces noise from small transaction samples.
Number of Homes Listed
Douglas Lake listings tend to cluster in Dandridge, Baneberry, White Pine, and the Jefferson City areas. Zillow and lake-home aggregators show roughly 150–225 active Douglas Lake-related listings at common 2025 snapshots, while broader municipal and county inventories number in the hundreds to low thousands depending on the county.
That concentrated lake inventory provides choice for buyers focused on lakefront living, acreage, or multi-bedroom cabins.
Active listing counts shift seasonally, with more inventory typically appearing in spring and summer. If you are shopping for lakefront features, monitor new listings closely because well-priced frontage often moves faster than inland properties.
Number of Homes Sold
Closed sales for Douglas Lake properties are fewer month to month than for metro neighborhoods, which makes city- or lake-level monthly counts volatile.
Redfin and local MLS snapshots show small batches of lakefront closings in each active season, while county totals provide a steadier picture of regional turnover; for example, Dandridge and Jefferson City county aggregates recorded dozens of closed sales in mid-2025, compared with a smaller handful of waterfront closings.
Because of the low monthly volumes for true lakefront homes, buyers should weigh recent closings over multi-year averages for the closest comparables and consider seasonal demand when timing offers.
Average Days on Market
Time on market for Douglas Lake listings is mixed by product type. MLS-oriented lake reports indicate average days on market for active lake homes often fall in the multi-week to multi-month range depending on price band and season; some brokers cite average DOM near 90–160 days for lake properties in 2025 snapshots, while county-level days-to-pending averages are typically shorter for general housing stock.
Expect longer DOMs for vacant land and higher DOM volatility for niche cabins.
Well-staged, competitively priced turnkey lakefront homes will show materially lower DOM than niche, heavily customized properties. That pattern reflects the broader buyer base for move-in ready lake homes versus the narrow buyer pool for unique parcels.
Price Drops
Price reductions occur regularly in the Douglas Lake market, especially on listings that are priced high for their frontage or need updates. Lake-focused broker reports and MLS snapshots from 2025 show a meaningful share of lake listings with price adjustments, a pattern consistent with broader regional market behavior as sellers calibrate to buyer demand.
Seasonal softening at the end of summer can trigger additional price reductions for homes that missed peak demand windows, which creates buying opportunities for well-prepared purchasers.
How Have Home Values Changed in Douglas Lake?
Douglas Lake prices are up in recent years, with the biggest gains on upgraded waterfront homes. Results vary by shoreline, slope, and access; inland sales move more slowly and react more to available inventory.
One-Year Change
One-year comparisons show modest appreciation for many Douglas Lake segments in 2025, with broker snapshots indicating 2–5% increases since 2024 for many improved lake homes; however, small sample sizes and mix effects mean variation is common between prime frontage and inland sales. Pair local closed sales with county ZHVI baselines to see both the transaction and typical-value stories.
Three-Year Change
Over three years the Douglas Lake area has benefited from steady interest in lakefront living, remote-work buyers, and retiree demand, driving multi-year gains in many price bands. County-level indexes show larger market moves when pandemic-era demand is included, and lakefront product outperformed broader county medians in many periods.
Five-Year Change
Five-year trends reflect a durable lift in value for improved lakefront properties and a modest re-rating of certain acreage parcels. Aggregated lake-home data suggest values for many upgraded lake homes remain above pre-pandemic levels, though not every segment rose equally.
Ten-Year Change
Over a decade Douglas Lake reflects steady long-term appeal for lakefront and acreage ownership in East Tennessee. Long horizons smooth short-term volatility from specific events and highlight the premium that waterfront and clear-access properties typically hold relative to inland comparables. Use county-level long-run indexes for the cleanest ten-year baseline.
How Are Mortgage Rates?
Freddie Mac’s Primary Mortgage Market Survey shows a 30-year fixed rate around 6.34% as of October 2, 2025, and Fannie Mae’s September 2025 forecast projects 30-year averages near 6.4% at end-2025 and 5.9% by end-2026. Those levels mean monthly payments for financed lake homes will remain above the low-rate environment of earlier years, which can temper buyer budgets and negotiation dynamics.
If rates ease toward the 5.5–6% range over the next 6–12 months, buyer activity could pick up, particularly for purchasers seeking second homes or long-term rental buys who underwrite based on financing costs. Conversely, persistent high rates tend to lengthen DOM and increase price sensitivity for financed buyers.
Is it a Buyer or Seller’s Market in Douglas Lake?
Short answer: it depends on the product. For well-priced, turnkey lakefront homes with good access and finished living spaces, the market often behaves seller-friendly during peak season because demand from vacation and second-home buyers is concentrated.
For vacant land, heavily customized cabins and higher-priced niche parcels, the balance leans toward buyers who can wait for the right deal. Investors evaluating lake properties should include occupancy seasonality and association rules, and confirm local restrictions or HOA requirements that affect rental use. Those operational details often swing the investment case more than headline sale prices.
FAQs
How many Douglas Lake listings are typically active at any time?
Broker and lake-site snapshots show roughly 150–225 Douglas Lake-related listings at common 2025 checkpoints, concentrated near Dandridge, Baneberry, and Jefferson City. That inventory gives buyers a meaningful set of choices but leaves prime frontage relatively scarce.
What is the typical lot size or acre mix on Douglas Lake listings?
Douglas Lake inventory includes a mix of small lakefront parcels, multi-acre lots, and finished homes on 0.2 to several acres. Listings often note acreage. Buyers seeking specific acre thresholds should filter by acre on MLS or lake-home sites and confirm deeded shoreline access.
Do Douglas Lake properties have association rules or HOA fees?
Some communities and resort subdivisions around Douglas Lake have HOAs or shared amenities; Douglas Lake Resort and similar areas maintain association rules and fees that cover common space maintenance. Review HOA documents for fee schedules, use rules, and any short-term rental policies before purchase.
How seasonal is rental and buyer demand?
Demand is strongly seasonal, with peak activity in spring, summer, and holiday windows. Seasonal occupancy affects both short-term rental income and showing traffic, so plan touring and offers with that seasonality in mind.


